Performance Evaluation of Scatter Plots in Bokeh with Large Datasets
Background
Starrydata contains a vast collection of data points, and the Starrydata Visualizer allows users to explore this vast dataset. However, visualizing datasets with hundreds of thousands of points in a single XY graph results in an initial rendering time exceeding 10 seconds, significantly interfering with usability. Bokeh version 2.4.3 was selected for its robust performance in handling large datasets, building upon its established use in the Starrydata ecosystem.
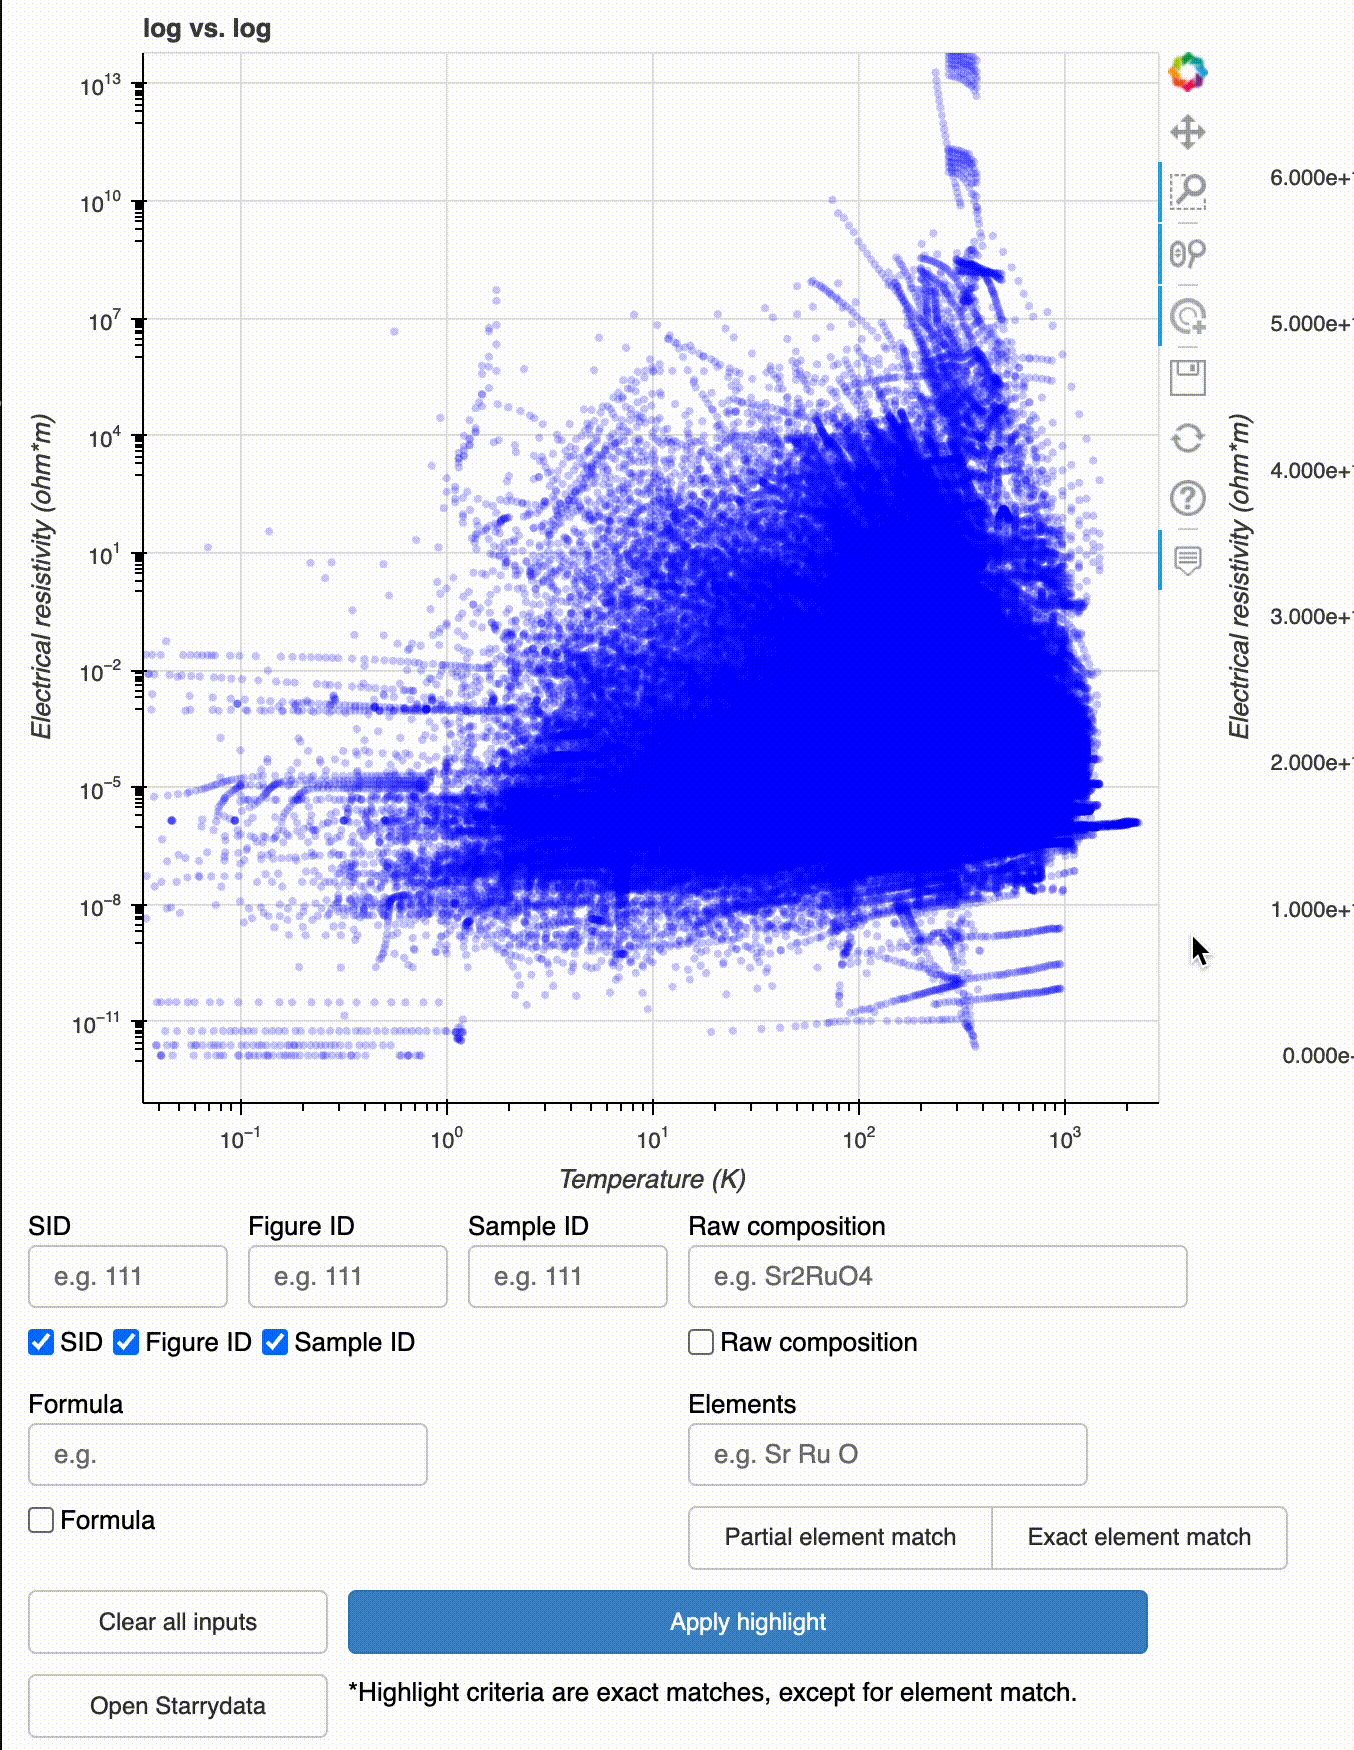
The above visualization showcases a graph of temperature-dependent electrical resistance containing 18,795 curves as of January 23, 2025. Users can view aggregated data and access ID and composition information for samples within Starrydata. Additionally, clicking on a point highlights all curves associated with that specific data point.
Experiment Overview
To assess and compare the performance of scatter plots in Bokeh with large datasets, we generated four types of HTML files using Bokeh and evaluated the following metrics:
- Initial Rendering Time
- Highlight Feature Speed, the primary functionality of the Starrydata Visualizer.
Experimental Setup
- Hardware: Development & Analysis MacBook
- Chip: Apple M3 Max
- Memory: 128GB
- OS: macOS Sonoma 14.5
- Software:
- Python Version: 3.10.14
- Bokeh Version: 2.4.3
-
Initial Rendering Time Measurement: The Google Chrome extension Page Load Time measured the time it took for the scatter plot to render fully.
-
Highlight Feature Speed Measurement: Recorded manually using an iPhone stopwatch to measure the responsiveness of the highlight feature.
- Number of Tests: Each test was conducted three times to ensure consistency.
Test Files Used
The following four HTML files, generated using Bokeh, were utilized in the experiments:
| Border | Marker Shape | File Path |
|---|---|---|
| Yes | Circle | scatter_border_circle-marker.html |
| Yes | Square | scatter_border_square-marker.html |
| No | Circle | scatter_no-border_circle-marker.html |
| No | Square | scatter_no-border_square-marker.html |
Note: The presence of borders requires additional rendering, and it was hypothesized that comparing square and circle markers would reveal that curves are more computationally intensive than simple shapes like a square.
Results
Initial Rendering Time
| Border | Marker Shape | Test 1 (s) | Test 2 (s) | Test 3 (s) | Average (s) |
|---|---|---|---|---|---|
| Yes | Circle | 9.8 | 10.1 | 9.6 | 9.8 |
| Yes | Square | 9.4 | 9.3 | 9.0 | 9.2 |
| No | Circle | 3.7 | 3.7 | 3.8 | 3.7 |
| No | Square | 3.7 | 3.7 | 3.7 | 3.7 |
Highlight Feature Speed
| Border | Marker Shape | Test 1 (s) | Test 2 (s) | Test 3 (s) | Average (s) |
|---|---|---|---|---|---|
| Yes | Circle | 13.2 | 12.8 | 12.9 | 12.9 |
| Yes | Square | 12.8 | 12.5 | 12.5 | 12.6 |
| No | Circle | 6.0 | 6.0 | 6.0 | 6.0 |
| No | Square | 6.3 | 6.2 | 6.1 | 6.2 |
Discussion
The results revealed that the type of marker (circle vs. square) did not significantly impact performance, contrary to our initial expectations. However, the presence of borders had a substantial effect, more than doubling the rendering and highlight times. This indicates that additional rendering complexities introduced by borders significantly affect performance.
Conclusion
While Bokeh 2.4.3 demonstrates robust performance in handling large datasets, certain visual elements such as borders can drastically impact rendering and interaction speeds. Optimizing these elements is crucial for enhancing the usability of the Starrydata Visualizer.
Upcoming Improvements
We are actively working on updating the Starrydata Visualizer to enhance its performance. These updates will focus on reducing rendering times and improving the responsiveness of interactive features. Stay tuned for these improvements in the near future.